Accurately estimating the range of an electric vehicle is a complex challenge due to numerous factors affecting energy consumption. While internal combustion engine vehicle owners have long accepted discrepancies in stated fuel economy, new and more rigorous test cycles aim to provide results that better reflect real-world conditions. But which testing cycle is the most reliable? The answer is nuanced. This article examines the most widely used range testing cycles and their intended purposes.
 WLTP Range Testing Cycle
EPA Cycle
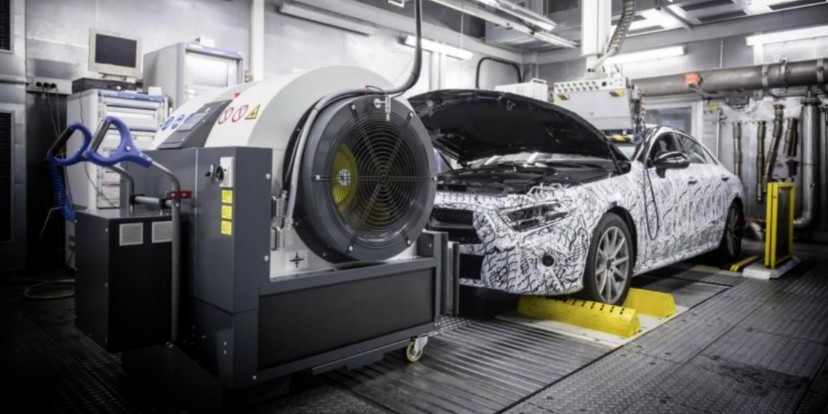
The EPA test cycle, used in the United States, is conducted on a dynamometer rather than on-road. Testing starts with a fully charged vehicle that remains idle overnight. The procedure involves alternating between the Urban Dynamometer Driving Schedule (UDDS) representing urban driving, and the Highway Fuel Economy Test (HWFET) representing highway conditions, with a 45% to 55% mix respectively, repeated until the battery is fully depleted.
After the test, the car is recharged using a precise meter to measure the energy drawn from the grid, incorporating onboard charger efficiency. A correction factor is then applied to simulate real-world conditions; this factor, which ranges between 0 and 1, depends on the number of driving cycles conducted. For example, a vehicle achieving 100 miles in the HWFET cycle with a correction factor of 0.8 will have an official EPA range of 80 miles.
The EPA cycle is generally considered the strictest of the major testing standards. However, it is not uniformly consistent across all electric vehicles. For instance, the Porsche Taycan’s official EPA range underestimates real-world performance by about 25%, while the Tesla Model S often struggles to meet its official EPA range due to Tesla’s different interpretation of the SAE J1634 standard.
 EPA Low and High Speed Cycles
NEDC Cycle
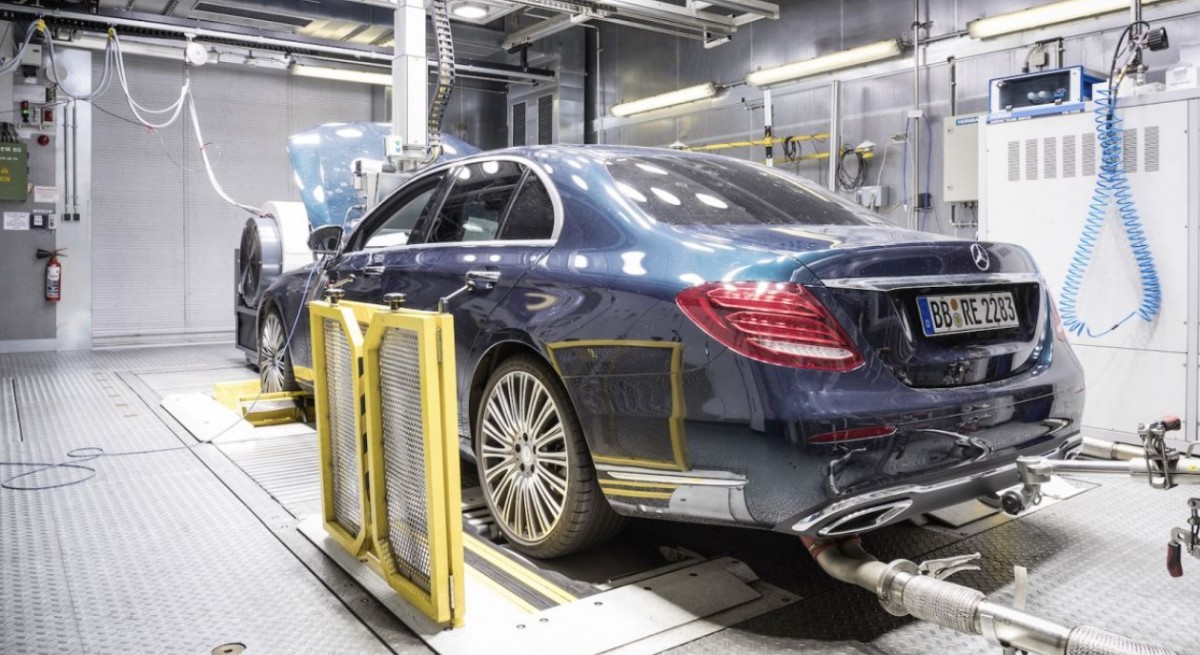
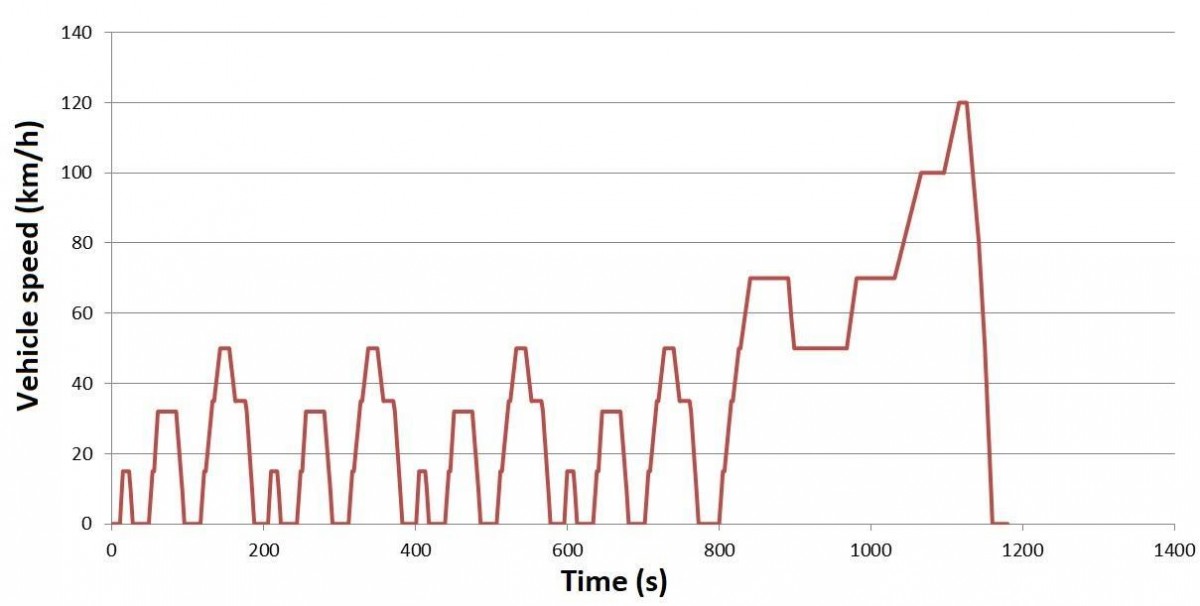
The New European Driving Cycle (NEDC) was used from the 1980s until September 2017. Like the EPA, it is a laboratory test comprising two subcycles: the urban phase represented by the ECE-R15 and the highway phase by the EUDC. The test simulates 11 kilometers of driving over 20 minutes, with an urban to highway driving ratio of 66% to 34%. No climate control or auxiliary electric loads are considered, and optional equipment does not affect results.
The average speed in the NEDC is 34 km/h with a maximum speed of 120 km/h. However, its consumption and range estimates are widely regarded as overly optimistic and significantly detached from real-life driving. This discrepancy led to its replacement by the WLTP cycle.
 The NEDC Cycle
WLTP Cycle
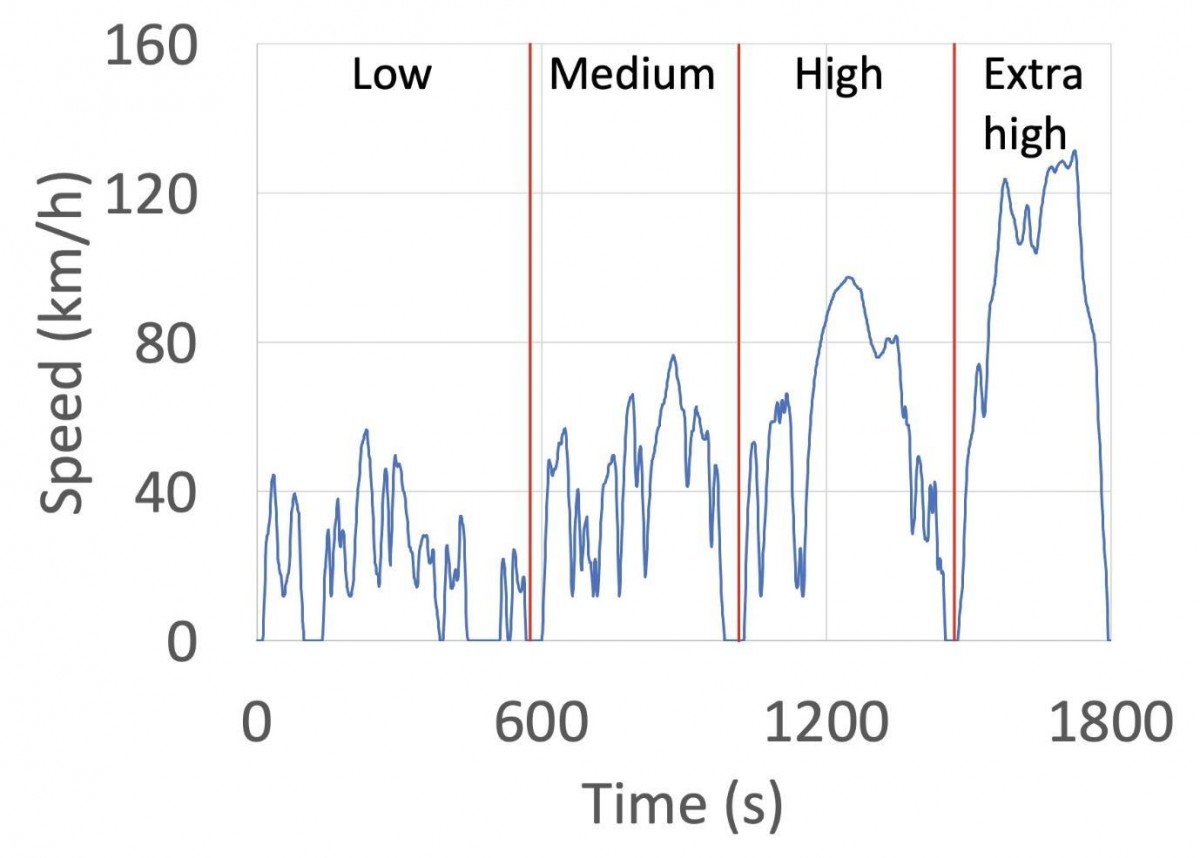
Introduced in Europe in September 2017, the Worldwide Harmonized Light Vehicle Test Procedure (WLTP) replaces the NEDC. This laboratory test covers a distance of 23.25 km over 30 minutes, divided into four phases representing low, medium, high, and extra-high speeds. The driving mix is 52% urban and 48% highway, with an average speed of 46.5 km/h and a maximum speed of 131 km/h.
Unlike the NEDC, WLTP accounts for the vehicle’s optional equipment and tire/wheel combinations. These factors influence energy consumption and range due to their effects on aerodynamics and unsprung mass.
 The WLTP Cycle
Which Test Cycle Is More Accurate?
Determining the most accurate test cycle is challenging because real-world driving habits and environments vary greatly. No single test can perfectly predict individual driving range, but test cycles can offer useful benchmarks when adjusted by personal driving factors.
The NEDC is generally considered the least accurate, producing optimistic results with significant variability between models, which led to its replacement. Both the WLTP and EPA cycles provide results closer to real-world performance, with the EPA cycle typically yielding more conservative estimates. However, the WLTP is often viewed as the most consistent across different vehicles and manufacturers.
Other regional test cycles also exist, such as China’s CLTC, which is similar to the NEDC, India’s IDC, and Japan’s JC08 cycle, the latter characterized by its use of very low speeds for emissions testing. The table below compares the range and power consumption of the VW E-Golf tested under the EPA, NEDC, and WLTP cycles.
| Model | Cycle | Range (km) | Power Consumption (kWh/100 km) |
|---|---|---|---|
| VW E-Golf | EPA | 190 | 17.5 |
| VW E-Golf | NEDC | 300 | 13.2 |
| VW E-Golf | WLTP | 231 | 15.8 |


