Evaluating Electric Vehicle Test Cycles: NEDC, EPA, and WLTP Explained
The pursuit of an accurate range estimate for electric vehicles (EVs) is a challenging endeavor. A myriad of factors influence a vehicle's electricity consumption, making it exceedingly difficult to predict its range with precision. For years, traditional Internal Combustion Engine (ICE) vehicle owners accepted somewhat inflated fuel consumption figures. However, recent advancements have introduced more rigorous testing cycles designed to represent real-world driving conditions more accurately. But which of these methods is the most reliable? To answer this, we will delve into three major test cycles: NEDC, EPA, and WLTP, analyzing their methodologies and findings.
EPA Cycle
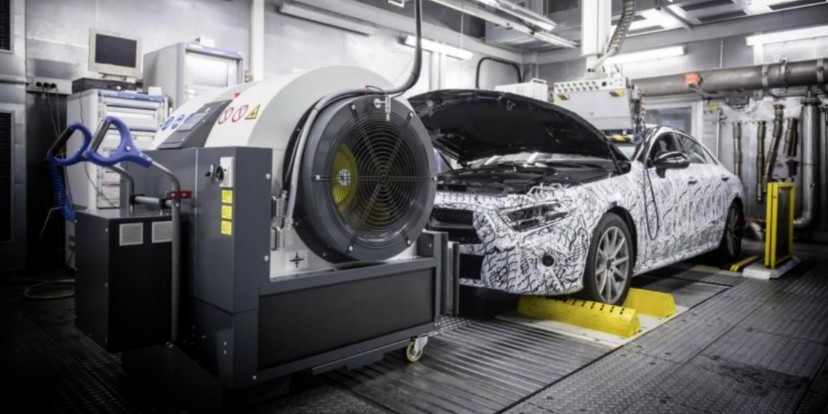
The EPA (Environmental Protection Agency) test cycle used in the United States employs a dynamometer method, testing vehicles in a lab setting rather than on actual roads. The cycle consists of two segments: the urban estimate (UDDS - Urban Dynamometer Driving Schedule) and the highway estimate (HWFET - Highway Fuel Economy Test).
The protocol begins with a fully charged vehicle, which is left to rest overnight before testing starts. The vehicle undergoes continuous UDDS and HWFET cycles until the battery is fully depleted, with a mix of 55% highway and 45% urban driving. Once depleted, the vehicle is recharged, and the total energy consumed is meticulously measured to calculate actual kWh usage from the grid.
A correction factor, varying between 0 and 1 based on the number of driving cycles tested, is applied to reflect real-world conditions. For instance, if a vehicle achieves a 100-mile range in the HWFET, but the correction factor is 0.8, the official range is reported as 80 miles. Generally, the EPA cycle is viewed as the most stringent among current testing methods. However, discrepancies can arise, as seen with models like the Porsche Taycan and Tesla Model S, which may not align with their EPA ratings.
NEDC Cycle
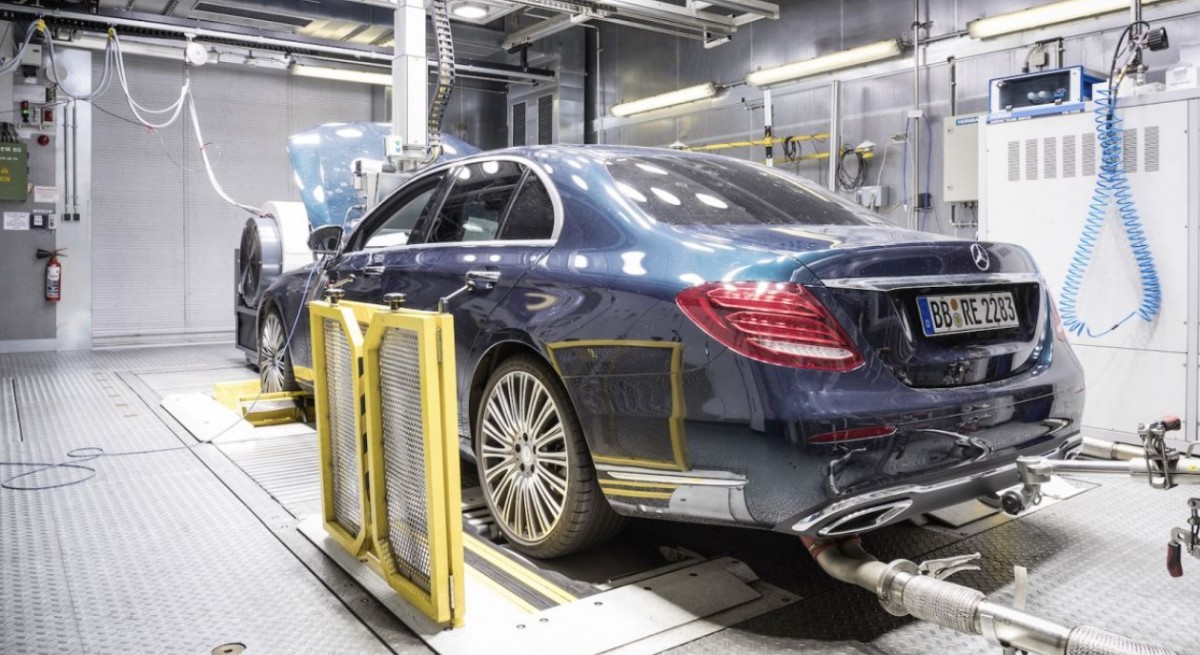
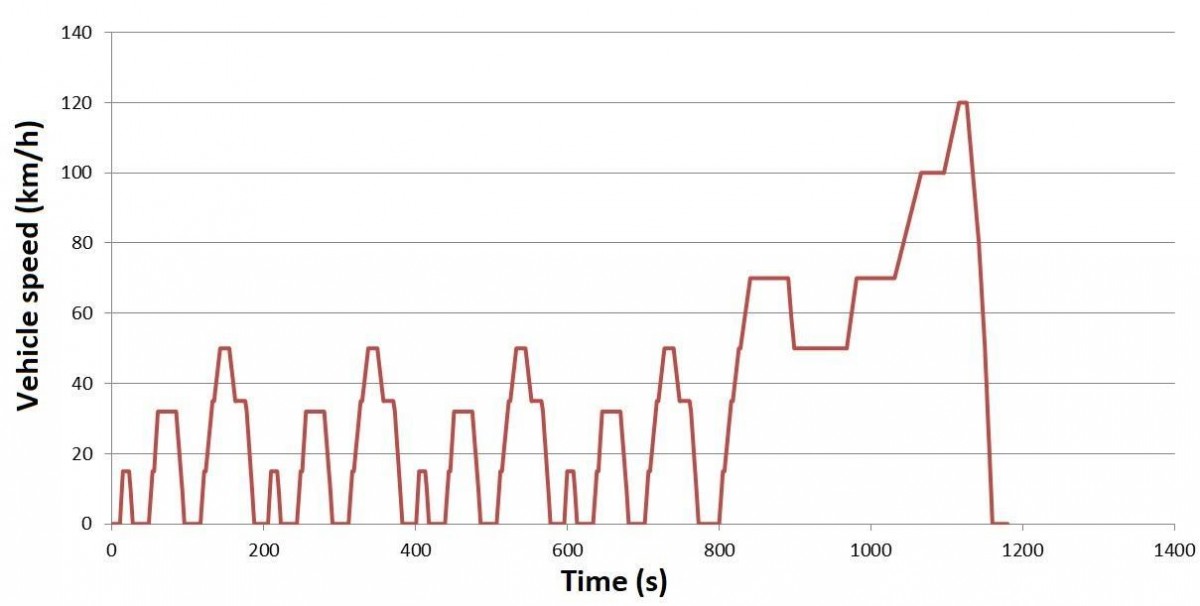
The NEDC (New European Driving Cycle), employed from the 1980s until its discontinuation in September 2017, also involves lab testing. It includes two phases: urban driving represented by the ECE-R15 subcycle, and highway driving represented by the EUDC subcycle.
The NEDC cycle comprises approximately 66% urban driving and 34% highway driving over an 11 km distance within a 20-minute timeframe. Notably, this test does not account for climate systems or electric auxiliaries, leading to much more optimistic consumption and range estimates. This disconnect from real-world performance was a primary reason for its replacement by the WLTP cycle.

WLTP Cycle
Since its introduction in September 2017, the WLTP (Worldwide Harmonized Light Vehicle Test Procedure) has replaced the NEDC cycle in Europe. Like its predecessors, the WLTP is conducted in a laboratory, but it is divided into four parts reflecting different average speeds. The total duration of the test is half an hour, covering a distance of 23.25 km.
The WLTP cycle incorporates a diverse range of speed segments—low, medium, high, and extra high speeds. Its topology mix includes 52% urban and 48% highway driving, with an average speed of 46.5 km/h and a maximum speed of 131 km/h. Importantly, the WLTP accounts for various equipment levels and the effects of tire and wheel combinations on energy consumption and range.
Comparative Accuracy of Test Cycles
Determining which test cycle is the most accurate does not yield a straightforward answer due to the myriad variables involved. Every driver's habits, environment, and vehicle use patterns differ; thus, no single test can accurately represent real-world performance for everyone. It is essential to interpret test results with a personal coefficient to project actual vehicle performance.
Among the cycles discussed, the NEDC was found to be the least reliable, yielding results with significant discrepancies across different models, leading to its rapid retirement. Both the WLTP and EPA cycles provide results that are closer to real-world performance, although the EPA tends to be the more conservative of the two. Overall, it appears that the WLTP cycle delivers the most consistent results across various manufacturers and models.
Other test cycles also exist globally, such as the Chinese CLTC, India's IDC cycle, and Japan's JC08 cycle, which adopts a low-speed approach for emissions testing. The following table illustrates the range and energy consumption of the VW e-Golf across the three major cycles:
| Model | Cycle | Range (km) | Power Consumption (kWh/100km) |
|---|---|---|---|
| VW E-Golf | EPA | 190 | 17.5 |
| VW E-Golf | NEDC | 300 | 13.2 |
| VW E-Golf | WLTP | 231 | 15.8 |